×
Chip and Dip

Chip and Dip is a Data Comic that depicts a scenario for how people navigate in the future.

About >

About

Abstract


The standing reserve questioned in this project is ‘the internet’. If humans continue to consume this reserve at the current rate it could have a dramatic environmental impact. The scenario presented, depicts the world if humans continue to consume the internet in abundance. It shows the dramatic lengths humans would have to go to sustain and grow the internet.


The focus of the scenario is navigation. This was chosen because the biggest issue during, the assignment one, experiment was navigation. The way humans navigate has massively changed over the last two sentries. Using a compass and the sun to navigate is a skillset that is rare in modern western society. Now humans use technology to find their way. To the point where the direction is not the question but what is the most efficient way.


During this project I learned that every human action has an impact on the planet. It is hard to view our actions, of using technology, as destructive in the context of here and now. However, when you look at the bigger picture and the massive changes that have occurred over time it is clear to see that the impact is huge. It seems that there needs to be a change in culture and the way we live our lives. The scenario presented focuses on living with the environmental aspects and adapting to circumstance using technology.


The infrastructure and culture are inspired from data patterns from environmental scientists and trends in the media. The following explains the interpretations of the reference research done.

Introduction


Chip and Dip is an illustrated scenario that depicts what London might look like in 30 years. It mainly explores the new ways humans might navigate if the landscape and infrastructure drastically changed.


The environmental ideas presented are inspired by data and research explored by scientists. Combined with technology trends that would feasibly fit into the scenario. Below are the inspiration figures used to create the scenario.

The idea of governing the internet is not new. The US created a corporation to oversee maintenance of the internet called Internet Corporation for Assigned Names and Numbers (ICANN). In 2016 (Farrell, 2016) ICANN changed it structure and became a global multi-stakeholder governance. Figure 1, bellow, is a diagram ICANN released explaining the different organisations that play a part in running the internet and the structure.
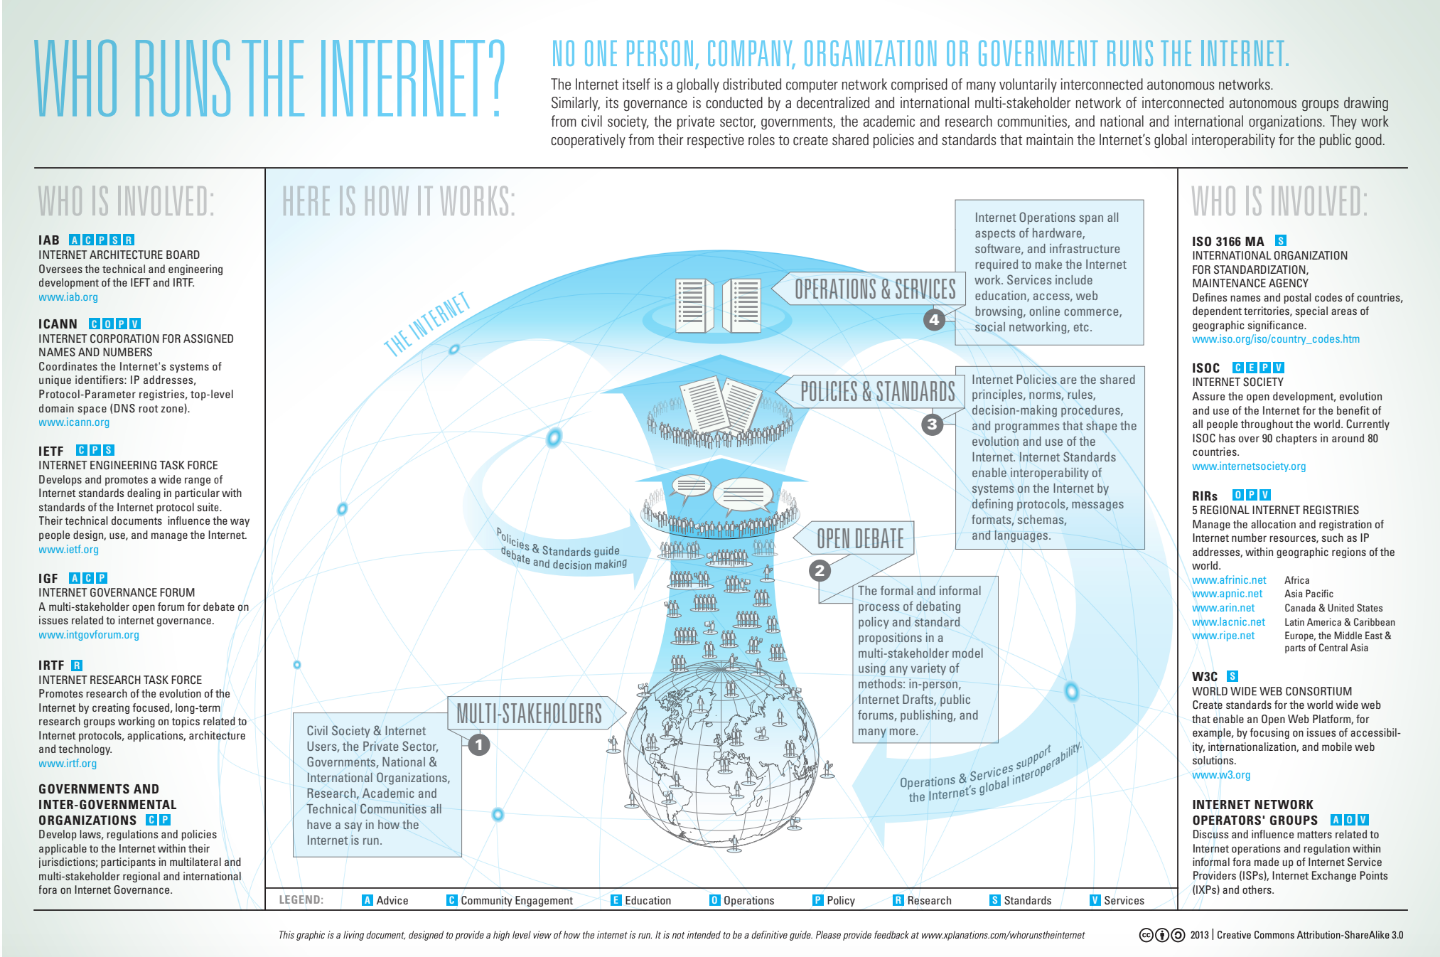
Figure 1 Who runs the internet? (ICANN, 2019)
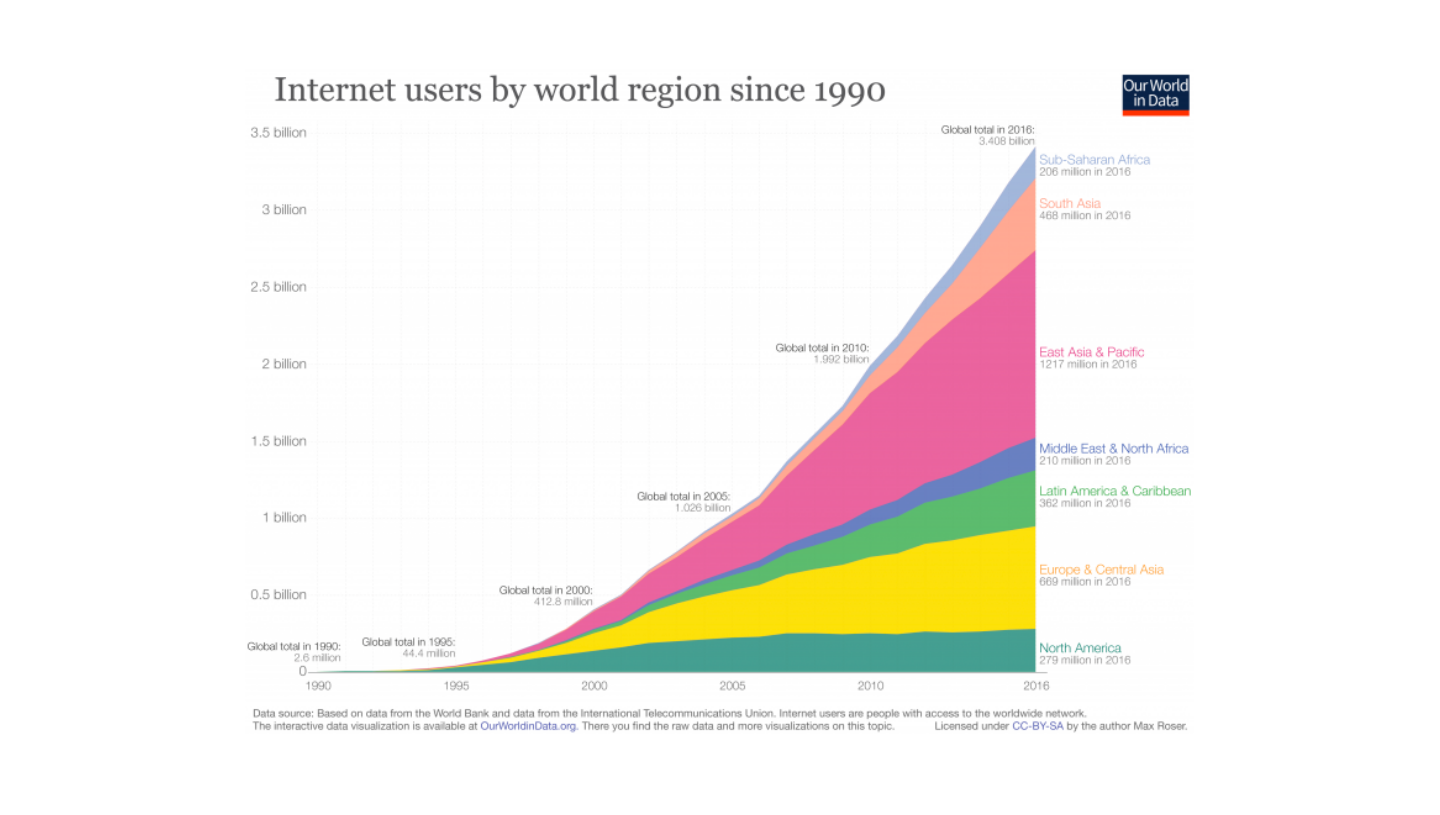
Figure 2 Internet users by world region since 1990 (Our World in Data, 2016)

The UN predicts that the world population will reach 9.8 billion in 2015 (2017). Figure 2 shows the growth of internet users from the birth of the internet till 2016. The population in 2016 was 7.4 billion and the number of internet users was 3.5 billion. This means that just over half the world population was an internet user. This growth trend was presumed to continue for the purposes of the scenario.
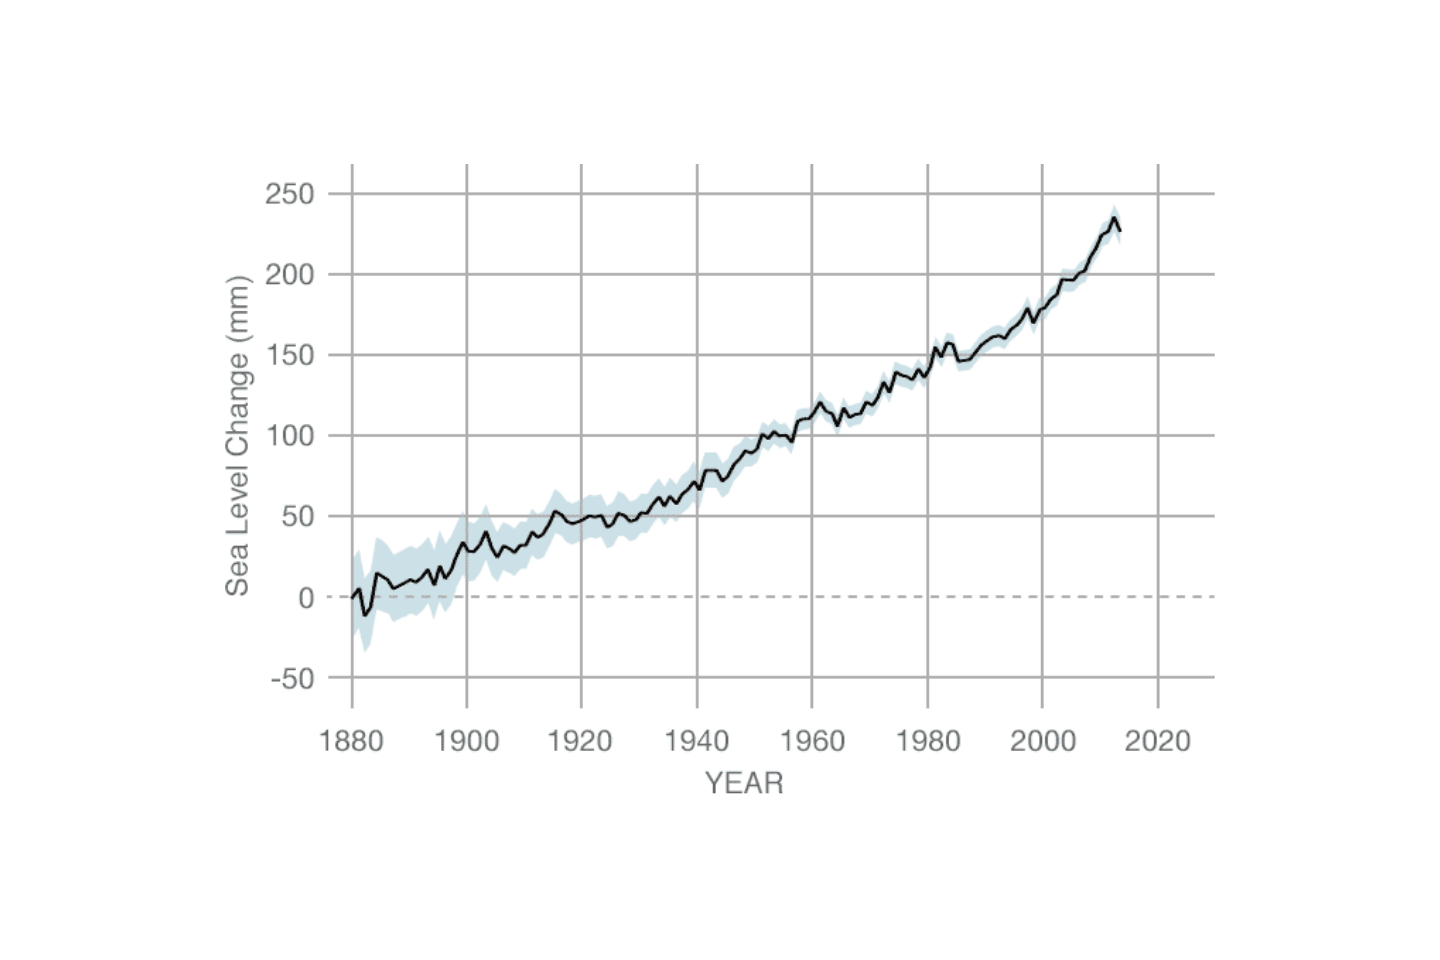
Figure 3 Sea level change (NASA, 2018)
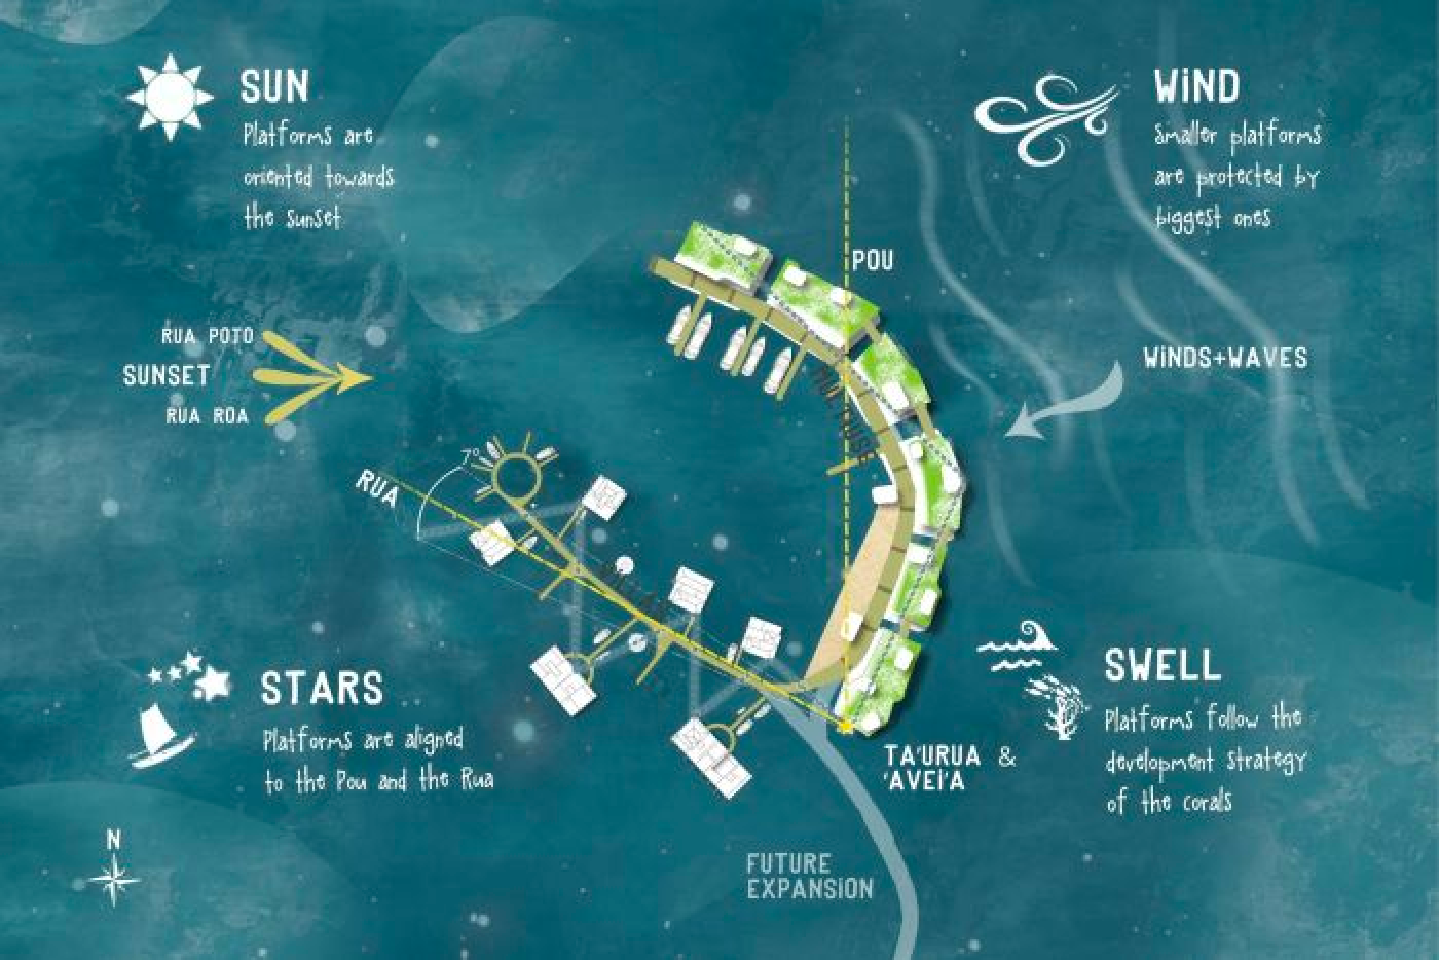
Figure 4 A concept design for Blue Frontiers’ French Polynesia floating community (Blue Frontiers, 2019)

Figure 5 depicts the waves of innovation from 1785 to 2020. The scenario is set in 2050, thirty years beyond the figure. The next wave of innovation is predicted to be bio-technology in the scenario. Microchip implants are currently being used as an alternative for keys, credit cards and train tickets by people in Sweden (South China Morning Post, 2018).
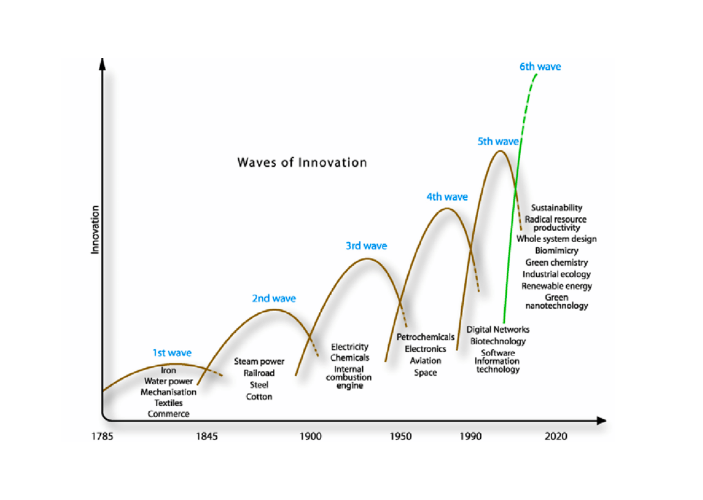
Figure 5 Waves of innovation (Mellalieu, 2019)

The microchip concept in the scenario is a slight evolution of this concept. That it is a microprocessor that runs the functionality for the augmented reality lens and connects it to the internet. Separate from the user’s cognition. However, beyond the future presented this could be a possibility. The microchip is implanted into the side of the users head to be provocative.
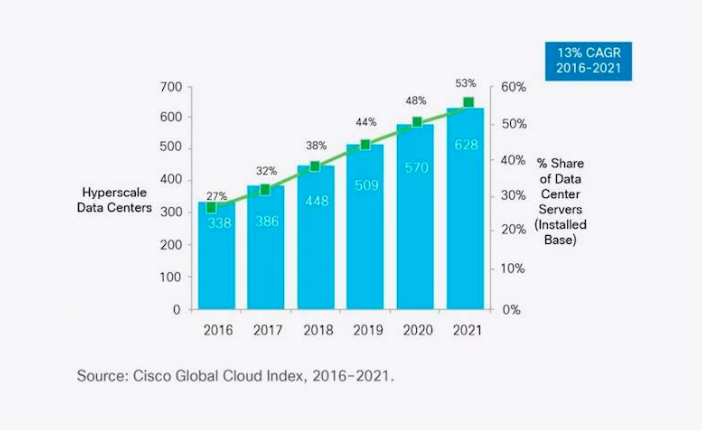
Figure 6 Global hyperscale data center growth (Cisco, 2018)
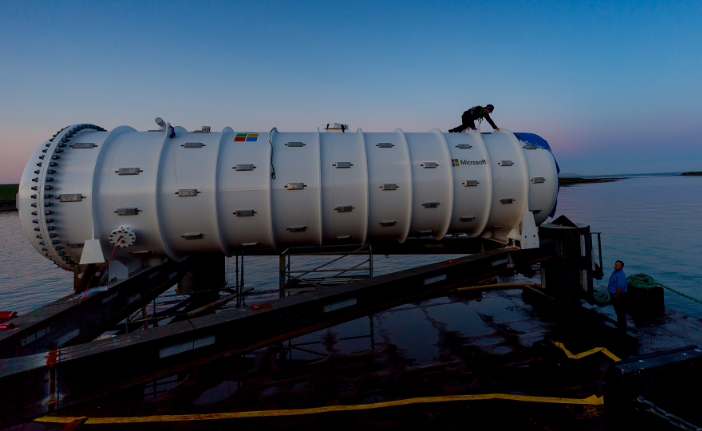
Figure 7 Microsoft underwater data center (Roach, 2018)

With more people using the internet naturally there would be a need for more data centres. With less land space and an abundance of space in the sea there could be potential to use the sea for storage. Figure 7 shows Microsofts submerged data centre. This was created as an experiment to see if data centres could be released quickly as and when needed.


I spoke to a data centre expert who believes that the idea of underwater data centres could work on a small scale. However, there would need to be thought put into using submerged data centres on a global scale. One major issue they pointed out was maintenance of small issues. They found it hard to imagine the expense of pulling a data centre up for a small issue would be financially viable.

Refrences


Blue Frontiers (2019). A concept design for Blue Frontiers’ French Polynesia floating community. [image] Available at: https://www.blue-frontiers.com/en/frenchpolynesia [Accessed 18 Apr. 2019].

Cisco (2018). Global hyperscale data center growth. [image] Available at: https://www.cisco.com/c/en/us/solutions/collateral/service-provider/global-cloud-index-gci/white-paper-c11-738085.html [Accessed 28 Mar. 2019].

Farrell, M. (2016). Quietly, symbolically, US control of the internet was just ended. [online] The Guardian. Available at: https://www.theguardian.com/technology/2016/mar/14/icann-internet-control-domain-names-iana [Accessed 28 Mar. 2019].

ICANN (2019). Who runs the internet?. [image] Available at: https://www.icann.org/en/system/files/files/governance-06feb13-en.pdf [Accessed 18 Apr. 2019].

Mellalieu, P. (2019). Waves of innovation. [image] Available at: https://www.researchgate.net/figure/Waves-of-innovation_fig3_228916224 [Accessed 18 Apr. 2019].

NASA (2019). Sea level change. [image] Available at: https://climate.nasa.gov/vital-signs/sea-level/ [Accessed 18 Apr. 2019].

National Geographic. (2013). What the World Would Look Like if All the Ice Melted. [online] Available at: https://www.nationalgeographic.com/magazine/2013/09/rising-seas-ice-melt-new-shoreline-maps/ [Accessed 18 Apr. 2019].

Our World in Data (2016). Internet users by world region since 1990. [image] Available at: https://ourworldindata.org/internet [Accessed 18 Apr. 2019].

Roach, J. (2018). Under the sea, Microsoft tests a datacenter that’s quick to deploy, could provide internet connectivity for years - Stories. [online] Microsoft. Available at: https://news.microsoft.com/features/under-the-sea-microsoft-tests-a-datacenter-thats-quick-to-deploy-could-provide-internet-connectivity-for-years/ [Accessed 28 Mar. 2019].

South China Morning Post. (2018). Why thousands of people in this country got microchip implants. [online] Available at: https://www.scmp.com/news/world/europe/article/2145896/thousands-people-sweden-get-microchip-implants-new-way-life [Accessed 18 Apr. 2019].

UN DESA | United Nations Department of Economic and Social Affairs. (2017). World population projected to reach 9.8 billion in 2050, and 11.2 billion in 2100 | UN DESA | United Nations Department of Economic and Social Affairs. [online] Available at: https://www.un.org/development/desa/en/news/population/world-population-prospects-2017.html [Accessed 28 Mar. 2019].